
Electronic Components Industry
2024 Results, 2025 Outlook, and Supply Chain/Innovation Metrics
Research Report for kunkune.co.uk
Published: August 2025
Executive Summary
Key Takeaways
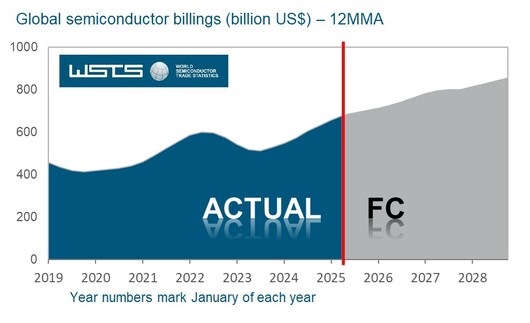
- • Global semiconductor sales rebounded to $630.5B in 2024 (+19.1% YoY)
- • WSTS forecasts $700.9B in 2025 (+11.2%) driven by logic and memory
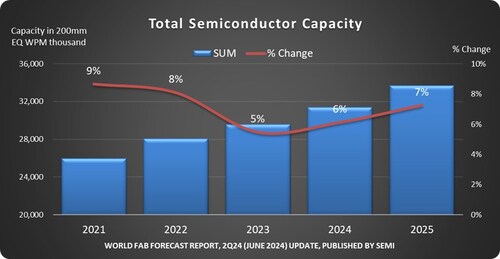
- • Fab capacity expanding 6% in 2024, 7% in 2025 to record 33.7M wafers/month
- • Supply chain pressures re-emerging: Lead time index hit record 166.6 in April 2025
- • EV market continues growth: 17M units expected in 2024 (>20% share)
The global electronic components industry demonstrated remarkable resilience in 2024, with semiconductor sales reaching an updated record of $630.5 billion, representing a 19.1% year-over-year increase from $526.8 billion in 2023. [Semiconductor Industry Association]
Regional performance varied significantly, with the Americas leading growth at +44.8%, followed by China (+18.3%) and Asia Pacific/All Others (+12.5%), while Japan (-0.4%) and Europe (-8.1%) experienced contractions. The World Semiconductor Trade Statistics (WSTS) projects continued momentum into 2025, forecasting $700.9 billion in sales (+11.2%). [WSTS]
Semiconductor Market Statistics
2024 Performance
- • Global sales: $630.5B (+19.1% YoY)
- • Q4 2024: $170.9B (+17.1% YoY)
- • Q3 2024: $166.0B (+23.2% YoY)
- • Dec 2024: $57.0B (-1.2% MoM)
2025 Outlook
- • Forecast: $700.9B (+11.2%)
- • Logic: Double-digit growth
- • Memory: Double-digit growth
- • Discretes: Low single-digit decline
Regional Performance 2024
| Region | YoY Growth | Performance |
|---|---|---|
| Americas | +44.8% | Strong AI/Data Center Demand |
| China | +18.3% | Domestic Production Ramp |
| APAC/Others | +12.5% | Manufacturing Recovery |
| Japan | -0.4% | Mature Market Challenges |
| Europe | -8.1% | Auto/Industrial Softness |
Fab Capacity & Equipment Investment
Capacity Expansion Highlights
Overall Growth
- • 2024: +6% to 31.7M wpm
- • 2025: +7% to 33.7M wpm
- • Leading-edge (≤5nm): +13% (2024), +17% (2025)
By Segment
- • Foundry: +11% (2024), +10% (2025)
- • DRAM: +9% both years
- • 3D NAND: 0% (2024), +5% (2025)
Equipment Sales Forecast
$125.5B
Total Equipment 2025
+7.4% YoY
$110.8B
WFE 2025
+6.2% YoY
$138.1B
Total Equipment 2026
+10.0% YoY
Sources: [SEMI via PR Newswire], [SEMI]
Memory Bit-Demand Recovery
DRAM Market
- • 2024 bit demand: +13% YoY
- • Equipment spending: +40.2% in 2024
- • HBM driving capacity investments
- • AI training/inference demand
NAND Flash Market
- • 2024 bit demand: +16% YoY
- • Equipment spending: +4.1% in 2024
- • 3D NAND stacking advances
- • Slow recovery from 2023 lows
After a challenging 2023 that established a low baseline, the memory sector experienced significant recovery in 2024. TrendForce anticipates year-over-year bit demand growth rates of 13% for DRAM and 16% for NAND Flash, driven by current low pricing for memory products and inventory restocking. [TrendForce]
Memory Technology Trends
- • HBM Adoption: Exploding AI adoption drives investment in high bandwidth memory
- • 3D NAND Evolution: Capacity expansion supporting advanced stacking technology
- • Process Migration: Leading manufacturers transitioning to next-gen nodes
- • Supply Discipline: Improved capacity utilization following inventory corrections
Passive Components Market
MLCC (Multilayer Ceramic Capacitors)
Global Market Size
4.193 Trillion
MLCC units demanded in 2023
+3% YoY growth
Murata Market Position
~40%
Global MLCC market share
Ships >1 trillion units/year
Supplier Concentration Risk
The MLCC market demonstrates significant supplier concentration, with Murata commanding an estimated 40% global market share and shipping over 1 trillion units annually. This concentration creates potential supply chain vulnerabilities.
Market Drivers
- • Automotive electronics
- • 5G infrastructure
- • Industrial automation
- • Consumer devices
Supply Challenges
- • High barrier to entry
- • Technology concentration
- • Capacity constraints
- • Raw material dependencies
Sources: [TrendForce], [Murata Value Report 2024]
Sensors & IoT Components
MEMS Market Recovery
$15.4B
2024 Revenue
+5%
YoY Growth
31B units shipped in 2024
2030 forecast: $19.2B
IoT Device Growth
18.8B
Connected Devices 2024
+13%
YoY Growth
2023: 16.6B devices
2030 forecast: ~40B devices

Sources: [Yole Group], [IoT Analytics]
PCB Industry Recovery
Global Market Estimates
-
Prismark (via TTM 10-K): $73.6B
-
iConnect007 estimate: $78.2B+6.3% YoY growth
Regional Production Share
- • China: ~56% (~$41.0B)
- • Rest of World: ~39% (~$29.2B)
- • Americas: ~5% (~$3.4B)
North American PCB Performance
April 2024 Performance:
Shipments: +9.4% YoY
Month-over-Month: +18.6%
Bookings: +2.6% YoY
Month-over-Month: +2.9%
PCB Market Drivers
Growth Catalysts
- • AI/Data center demand
- • 5G infrastructure
- • Electric vehicle adoption
- • Industrial automation
Technology Trends
- • Higher layer counts
- • Advanced packaging
- • Flexible/rigid-flex
- • Embedded components
Sources: [TTM Technologies 10-K citing Prismark], [iConnect007], [EPP Europe News]
Automotive & EV Markets
92.5M
Global Vehicle Production 2024
-1% YoY
17M
EV Sales 2024 (Forecast)
~20% market share
$67B
Auto Semiconductors 2023
+12% YoY
Top Vehicle Producing Countries (2024)
| Country | Production (M units) | YoY Change |
|---|---|---|
| China | 31.28 | +4% |
| USA | 10.56 | -1% |
| Japan | 8.23 | -9% |
| India | 6.01 | +3% |
| Mexico | 4.20 | +5% |
| Germany | 4.07 | -1% |
EV Market Momentum
Global Growth
- • 2023: 14M units (18% share)
- • 2024F: 17M units (>20% share)
- • 35% YoY growth in 2023
Regional Outlook 2024
- • China: ~45% EV share
- • Europe: ~25% EV share
- • USA: >11% EV share
Semiconductor Impact
- • Power electronics demand
- • MCU/sensor growth
- • Battery management ICs
Sources: [OICA], [Semiconductor Intelligence], [IEA Global EV Outlook 2024]
Trade & Supplier Concentration
Integrated Circuits Trade (HS 8542) – 2023
Global Trade Volume
Market Concentration
• Top 5 importers: 82.2% of trade
• Top 5 exporters: 80.4% of trade
• Asian hubs dominate flows
Top IC Importers 2023
Top IC Exporters 2023
Supply Chain Risk Assessment
The concentration of IC trade in a few Asian hubs creates systemic risks. Hong Kong and China combined account for ~58% of IC exports, while China alone represents 38% of global imports.
Risk Factors
- • Geopolitical tensions
- • Trade policy changes
- • Logistics bottlenecks
- • Natural disasters
Mitigation Strategies
- • Supply chain diversification
- • Strategic inventory
- • Alternative sourcing
- • Nearshoring initiatives
Source: [TrendEconomy]
Supply Chain Indicators
Lead Time Alert: 2025 Surge
Supply chain pressures have returned with unprecedented intensity in 2025, surpassing even the pandemic-era disruptions.
Current Status
- • Supplyframe Index: 166.6 (Apr 2025)
- • Previous record: 146.7 (Jan 2022)
- • 85% increase Mar→Apr 2025
- • Capacitors: +43% lead time spike
Key Drivers
- • Trade policy uncertainties
- • AI infrastructure demand
- • Inventory destocking
- • Supplier diversification efforts
Lead Time Evolution
25.8 weeks
Peak Lead Time
Q4 2021 (Susquehanna)
~24 weeks
Improved Level
Dec 2022 (-8 days MoM)
166.6
Lead Time Index
Apr 2025 (Record High)
Industry Sentiment
ECIA ECST Survey (June 2024)
Component Index: 98.9 (-13.4 points MoM)
Cumulative decline: -25 points (May-June)
Below 100 = contraction
July Outlook: 111.9 (expected)
Improvement: +13 points
Cautious optimism
Sources: [Astute Group], [Pasadena Now], [Supply & Demand Chain Executive], [ECIA]
Innovation & R&D Investment
U.S. R&D Leadership
Investment Scale
Industry Ranking
• 2nd highest R&D intensity among U.S. industries
• Only behind pharma/biotech sector
• Sustained >15% rate for 20+ years
• Drives global technology leadership
$62.7B
U.S. Semiconductor R&D
2024 (+5.7% YoY)
17.7%
R&D/Revenue Ratio
2nd highest U.S. industry
20+
Years >15% R&D Rate
Sustained innovation
R&D Focus Areas
Technology Priorities
- • Advanced process nodes (3nm, 2nm)
- • AI/ML accelerator architectures
- • Quantum computing development
- • Advanced packaging solutions
- • Power efficiency innovations
Strategic Investments
- • Materials science research
- • EUV lithography advancement
- • Chiplet/heterogeneous integration
- • Neuromorphic computing
- • Sustainability technologies
Source: [Semiconductor Industry Association – State of the Industry 2025]
Statistical Appendix
Key Market Indicators
Supply Chain Metrics
Data Sources
• Semiconductor Industry Association (SIA) – Global sales data and regional breakdowns
• World Semiconductor Trade Statistics (WSTS) – Market forecasts and segment analysis
• SEMI – Fab capacity projections and equipment sales forecasts
• TrendForce – Memory bit-demand and MLCC market sizing
• Yole Group – MEMS market analysis and unit shipments
• IoT Analytics – Connected device projections and growth rates
• OICA – Global vehicle production statistics
• IEA – Electric vehicle market analysis and regional forecasts
• TrendEconomy – Integrated circuit trade flow data
• Supplyframe/Susquehanna – Lead time indicators and supply chain metrics
• ECIA – Electronic component sales trends and sentiment
• Various industry sources – PCB market estimates and regional data
Report Methodology: This analysis combines data from authoritative industry sources, regulatory filings, and market research organizations. All statistics include inline citations to enable verification and deeper research. Market estimates may vary between sources due to different methodologies and scope definitions.